


For the week ending Aug. 14, year-to-date (YTD) downbound barged grain volumes on the Mississippi River reached 25.2 million tons—20% higher than 2020 and 14% higher than the previous five-year average, according to U.S. Department of Agriculture data.
Strong demand for exports from China has been the main driving force behind these robust volumes. However, high barge tonnages have so far failed to buoy spot freight rates. Rates have mostly followed historical patterns, declining moderately since the beginning of the year.
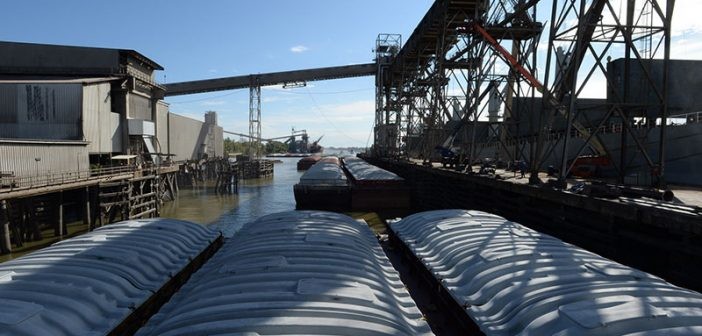
Here's a review of developments in barged grain movements and freight rates for 2021 to date from the USDA.
Strong Barged Grain Movements
Despite wide fluctuations, weekly movements in 2021 stayed high—or at least on par with historical averages—until June. By the beginning of January, barges had already moved a record 16.3 million tons of grain for market year (MY) 2020/21, which is 35% higher than by the same time in MY 2019/20 and 17% higher than the average of the previous five years.
In mid-January—despite the cold weather and seasonal closure of the Upper Mississippi River—weekly barged grain movements reached a record-high 1.1 million tons. From late January through late February, severe winter weather completely halted traffic on the Upper Mississippi and barged grain movements fell sharply. In March, better weather and strong corn demand from China once again raised barged grain movements. Movements peaked at roughly 1.1 million tons (far above the five-year average) in the first week of June. In the second week of June, weekly volumes again started to fall, dropping to levels below historical patterns and have yet to recover. This trend runs counter to the typical summer rise in volumes that occurs when producers and shippers move old crops out of storage to prepare for the new harvest. Despite low weekly tonnages between June and July, 2021 still accumulated record-high year-to-date (YTD) volumes at the end of July (24.1 million tons).
The composition of 2021 barged grain movements resembled that of previous years, with corn forming the largest share. Corn’s share of YTD total tonnages reached 75% in 2021, about 14% higher than the average of the previous five years. Meanwhile the 2021 share of soybeans (21%) dropped 12% from the five-year average. Together, corn and soybeans constituted more than 96% of total downbound barged grain movements on the Mississippi River.
Moderate Spot Freight Rates Persist
Barge spot rates in St. Louis have trended moderately down from the beginning of the year through the end of July. The St. Louis spot rates fell from 505% of tariff ($20 per ton) in November 2020 to 300% of tariff ($12 per ton) in January, before dropping further to 200% of tariff ($8 per ton) in June. The YTD average spot freight rate was 252% of tariff at the end of July—26% higher than YTD at the same time time in 2020 and equal to the previous five-year average.
Looking Forward
In summary, the first half of 2021 has seen an overall robust demand for barged grain movements (mostly corn). The average spot freight rates, although higher than 2020’s average, did not increase with volumes, as barge supply has been adequate to handle the increased demand for the nearby old crop movements (other than previously committed services).
Looking ahead, the strong forward rates for the new crop year suggest the industry’s overall optimistic projection for a strong demand for barged grain movements in MY 2021/22, despite potential challenges from rising ocean freight rates, competition from domestic crop demand (such as ethanol and soybean crushing), and overall market uncertainty.