Transportation fatalities in the United States increased by three percent in 2012 from 2011, according to preliminary figures released last week by the National Transportation Safety Board.
The data indicate that transportation fatalities in all modes totaled 35,531 in 2012, compared to 34,551 in 2011. Although marine, aviation and pipeline deaths declined, highway and rail fatalities showed an increase.
"We have a serious public health and safety epidemic on our highways," said NTSB Chairman Deborah A. P. Hersman. "With our Most Wanted List, the NTSB highlights common-sense solutions to these safety issues that can improve safety and reduce the loss of life on our roads, rails, and waterways and in our skies."
The 2012 statistics show:
Deaths on U.S. roadways, which account for nearly 94 percent of all transportation deaths, increased from 32,479 in 2011 to 33,561 in 2012. Highway fatalities increased in all categories except buses, which are down from 55 fatalities in 2011 to 39 in 2012.
Railroad deaths also increased six percent from 757 to 803. The vast majority of these fatalities were persons struck by a rail vehicle.
Aviation deaths decreased from 498 to 449. Nearly 96 percent of aviation fatalities occurred in general aviation accidents (432), but they still represented a decrease from the previous year (448). In 2012, air taxi fatalities dropped from 41 in 2011 to 15.
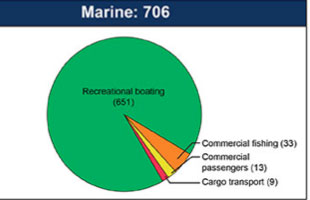
Marine deaths also dropped in 2012, from 803 to 706. The vast majority of the fatalities, (651), occurred in recreational boating
Aviation statistics are tracked and compiled by the NTSB. The U.S. Department of Homeland Security provides marine statistics, and the U.S. Department of Transportation provides statistics for all other modes.
2011-2012 U.S. Transportation Fatalities
| ||||
| 2011 | 20121 | |||
| Highway: | Passenger cars | 12,014 | 12,271 | |
| Light trucks and vans | 9,302 | 9,396 | ||
| Pedestrians | 4,457 | 4,743 | ||
| Motorcycles | 4,630 | 4,957 | ||
| Pedalcycles 2 | 682 | 726 | ||
| Medium and heavy trucks | 640 | 697 | ||
| Buses | 55 | 39 | ||
| Other 3 | 699 | 732 | ||
| Total, Highway | 32,479 | 33,561 | ||
| Grade Crossings: 4 | (250) | (233) | ||
| Rail: | Intercity 5M - | |||
| Trespassers and nontrespassers 6 | 497 | 509 | ||
| Employees and contractors | 24 | 19 | ||
| Passengers | 6 | 5 | ||
| Transit 7 - | ||||
| Light, heavy, and commuter rail | 230 | 270 | ||
| Total, Rail | 757 | 803 | ||
| Marine: | Recreational boating | 758 | 651 | |
| Cargo transport | 10 | 9 | ||
| Commercial fishing 8 | 27 | 33 | ||
| Commercial passengers | 8 | 13 | ||
| Total, Marine | 803 | 706 | ||
| Aviation: | General aviation | 448 | 432 | |
| Airlines | 0 | 0 | ||
| Air taxi | 41 | 15 | ||
| Commuter | 0 | 0 | ||
| Foreign/unregistered 9 | 9 | 2 | ||
| Total, Aviation | 498 | 449 | ||
| Pipeline: | Gas | 13 | 9 | |
| Liquids | 1 | 3 | ||
| Total, Pipeline | 14 | 12 | ||
| Total | 34,551 | 35,531 | ||
1 Numbers for 2012 are preliminary estimates. Aviation data are from the NTSB; marine data are from the U.S. | ||||


