


The U.S. Department of Transportation (DOT) shared the latest Transportation Supply Chain Indicators Tracker early this month.
Since the beginning of the Covid-19 pandemic, the DOT has seen stressed supply chains, as historic levels of goods coming into the U.S., aging infrastructure, the pandemic, and geopolitical disruptions continue to cause bottlenecks, congestion, and challenges in global markets.
Despite challenges, there are signs of progress in the U.S. goods movement chain. U.S. ports — including the Ports of Los Angeles and Long Beach collectively — imported more containers than any previous January. The total number of containerships waiting for berths at U.S. ports has dropped by 35% since peaking in early February and freight railroads’ weekly intermodal movements in March approached their highest levels of 2022. Goods are successfully being delivered to shelves and real retail inventories excluding autos are at their highest levels in history and 6% above pre-pandemic levels, the DOT said.
This progress builds on continued action by DOT and the administration's Supply Chain Disruptions Task Force to move ports toward 24/7 operations, improve recruitment and retention in the trucking workforce, and speed the movement of goods by rail and other modes.
Earlier this month, DOT announced a data sharing effort called Freight Logistics Optimization Works (FLOW). FLOW has initial participants including Target, FedEx, UPS, True Value, ocean shippers and ports, that represent diverse perspectives across the supply chain. This effort will foster an information exchange to ease supply chain congestion, speed up the movement of goods, and ultimately cut costs for U.S. consumers. In February, DOT announced the availability of $450 million in funds for U.S. ports, and published a comprehensive report with recommendations for the future of U.S. supply chains.
The DOT still see challenges on the horizon and continues to monitor potential disruptions. Covid-19 outbreaks across Asia and Russia’s war of aggression could impact supply chains in the U.S. DOT continues to work with partner agencies and stakeholders from industry and labor to help speed up the movement of goods, and ultimately make goods more affordable for U.S. people.
BACKGROUND ON THE TRACKER
Over the course of the past year, as part of the president’s Supply Chain Disruptions Task Force (Task Force), DOT and the departments of Commerce and Agriculture, have been part of an nationwide effort to improve the flow of goods, make supply chains more resilient, and lower prices for Americans.
Freight and logistics supply chains are largely operated by the private sector. To support greater transparency about the state of U.S. transportation supply chains, last fall, the Task Force released a dashboard tracking real-time challenges and progress across four key metrics. DOT is continuing to track those four metrics and others to help depict a more complete picture of the current logistics and transportation state-of-play. The DOT’s Transportation Supply Chain Indicators Tracker (Tracker) provides updates on key supply chain data — including measures and indicators of intermodal throughput such as volumes of U.S. imports and exports, transportation labor numbers, the number of containerships anchored and loitering near U.S. ports, and more.
The Tracker is a collaboration across many departments participating in the Task Force and is intended to provide information about critical supply chains to the public. It will be updated over time, including additions and adjustments as data and information are refined. DOT and other members of the Task Force are working closely with private companies and public agencies to address supply chain disruptions and improve the movement of goods across the country.
The following measures are provided in this update:
- U.S. container imports & exports at ports, overall
- U.S. container imports, at major ports
- Container ships awaiting berths at U.S. ports
- Ports of Los Angeles and Long Beach container dwell time
- Sector job openings, hires, and quits
- Truck employment count
- Rail intermodal volume
Non-Transportation Supply Chain Measures
8. U.S. retail inventories
Imports and Exports: Monitoring containerized imports and exports helps identify potential capacity constraints and stresses to U.S. supply chains.
1/ There has been a sustained increase in containerized imports to U.S. ports.
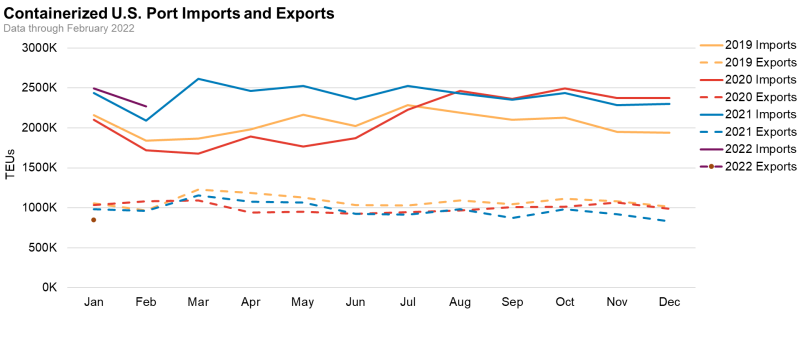
Chart depicts the total volume of containerized imports and exports (measured as Twenty-foot Equivalent Units (TEUs)) moved through U.S. ports for each month since January 2019.
2/ Increased container import volume has been observed at many ports, compared to pre-pandemic levels.
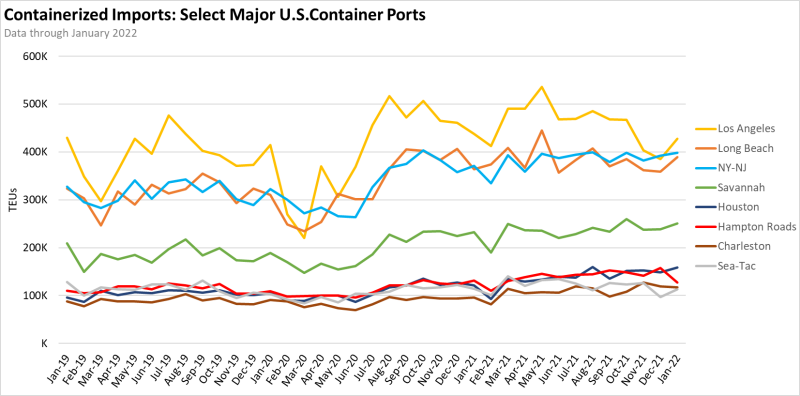
Chart depicts total volume of containerized imports (measured as Twenty-foot Equivalent Units (TEUs)) at select U.S. ports overall since January 2019.
Ships and Containers: Monitoring the number of ships waiting for berths at U.S. ports, and the rate at which imported containers move inland from the ports, can help measure disruptions in supply chains, including at original port of call, port of destination, and inland modes.
3/ Since the middle of 2021, the number of container ships waiting for a dock at a U.S. port has more than doubled, peaking at more than 150 in early February, although levels have declined since then.
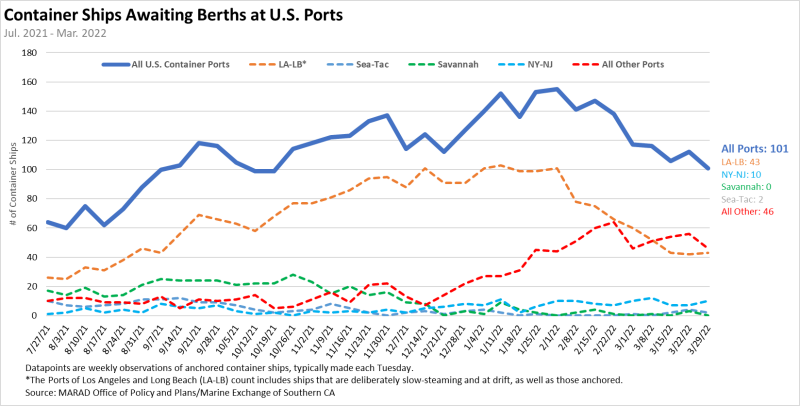
Chart depicts the total number of container ships waiting for an available dock at U.S. ports overall (solid line) and select major port complexes (dashed lines).
4/ In late October 2021, the Ports of Los Angeles and Long Beach, which account for around 37% of all U.S. containerized imports, announced intentions to levy fees on long dwelling containers. Since that time, 70,000 fewer are dwelling more than 9 days or more on the ports—a 54% improvement.
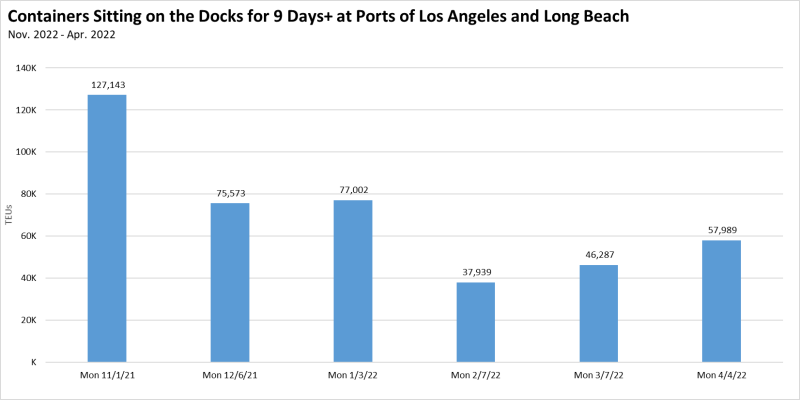
Chart depicts the total number of imported containers sitting at terminals at the Ports of Los Angeles and Long Beach for 9 days or more, (i.e. long-dwelling). The chart shows the approximate total of long dwelling containers reported on the first Monday of each month since November 2021. Estimated TEU measure is calculated using a standard practice of multiplying total units reported by the ports by a factor of 1.8.
Workforce: Monitoring job openings and employment trends across the sector helps understand how labor capacity may impact supply chain fluidity.
5/ In 2021, job openings increased substantially, outpacing a slight increase in hiring, in the Transportation, Warehousing, and Utilities sector.
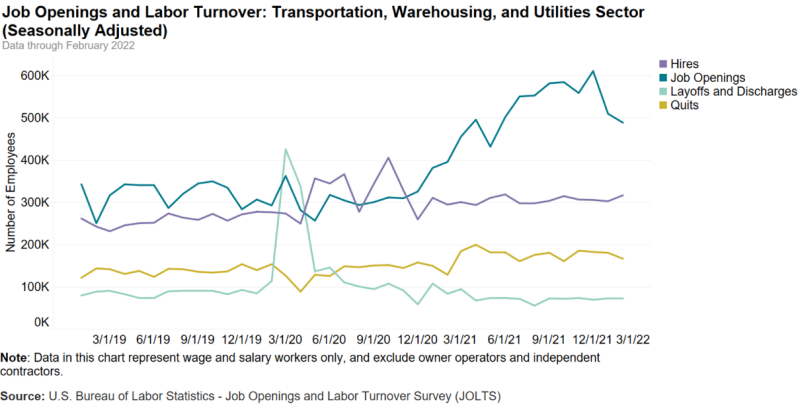
Chart depicts job openings and labor turnover in the Transportation, Warehousing, and Utilities sector of the economy, by month.
6/ As of February 2022, the trucking industry has recovered 50,000 workers since one year earlier, and sits at around 30,000 higher than at start of the pandemic.
![]()
Chart depicts the number of employees working in the truck transportation subsector of the economy, on a monthly basis, and includes the drivers, mechanics, managers, and laborers/movers involved in this sector. Self-employed drivers, known as owner-operators, are not included in this measure.
Rail: Measuring and monitoring intermodal units moved by rail helps identify capacity constraints on U.S. railroads and potential stresses to U.S. supply chains, overall.
7/ Intermodal movements by freight rail have generally trended at or above pre-pandemic (2019) levels.
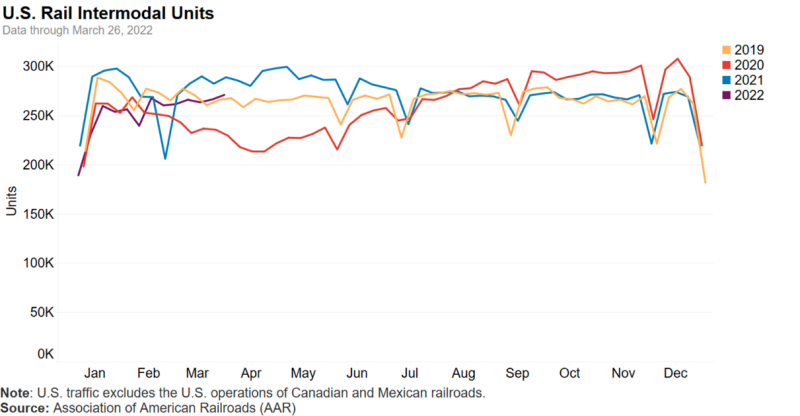
Chart depicts how many shipping containers and truck trailers are moved on rail cars in a given week on U.S. Class I Railroads. Approximately half of all railroad traffic is intermodal.
Non-Transportation Supply Chain Indicators
8/ Retail inventories excluding autos were more than 6 percent above pre-pandemic levels at the end of February. Higher frequency data from grocery and drug stores show that the share of products that were in stock was 90 percent the week ending March 27, 2022 compared to 91 percent the week ending February 23, 2020.
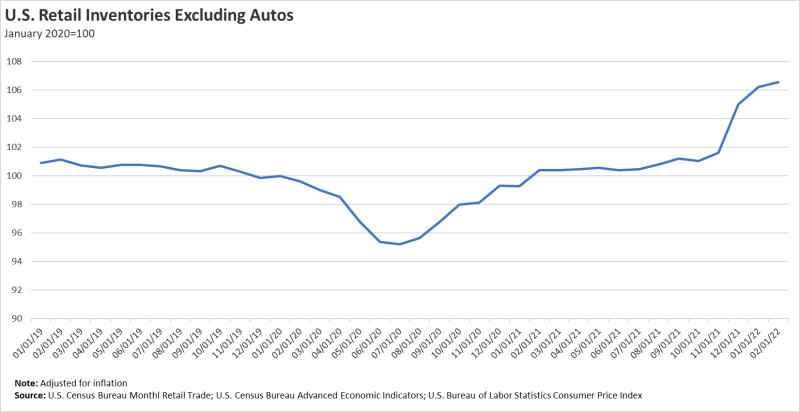
Chart depicts the inflation-adjusted value of the goods in retailers’ warehouses and on their shelves excluding motor vehicle and parts dealers