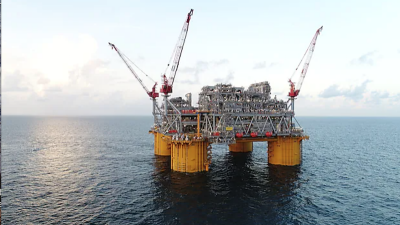
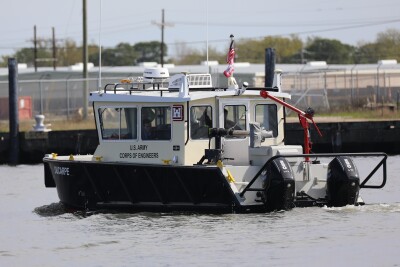
Tugs, towboats, pushboats and barges dominate the waterways, with more than half of survey respondents listing these as the primary vessels they operate.

Download the entire report for $195
Check out our compensation calculator
But the number of vessels a company actually owns or operates varies pretty drastically.

Download the entire report for $195
Check out our compensation calculator
As one might expect, regional location affected total compensation, with respondents from the East and West South Central region earning the most generous total compensation in 2012.

Download the entire report for $195
Check out our compensation calculator
Pay is pretty even across most sectors, with base salaries in 2012 averaging more than $100,000.

Download the entire report for $195
Check out our compensation calculator
But, the divide in salary between genders is evident. Men were paid more per year than women in 2012 — about $17,000 more.

Download the entire report for $195
Check out our compensation calculator
In 2012, the median salary of our survey respondents was $7,500 higher than the median salary reported by respondents in 2010. While different individuals take the survey each time, it's still interesting to note the upward shift in salary distribution.
(1).jpg)


